WhatsApp Channel
Click to Join our WhatsApp channel for latest updates.
Telegram Channel
Click to Follow Telegram Channel for real-time updates.
Instagram Channel
Click to Join our Instagram channel for latest updates
Click to Join our WhatsApp channel for latest updates.
Click to Follow Telegram Channel for real-time updates.
Click to Join our Instagram channel for latest updates
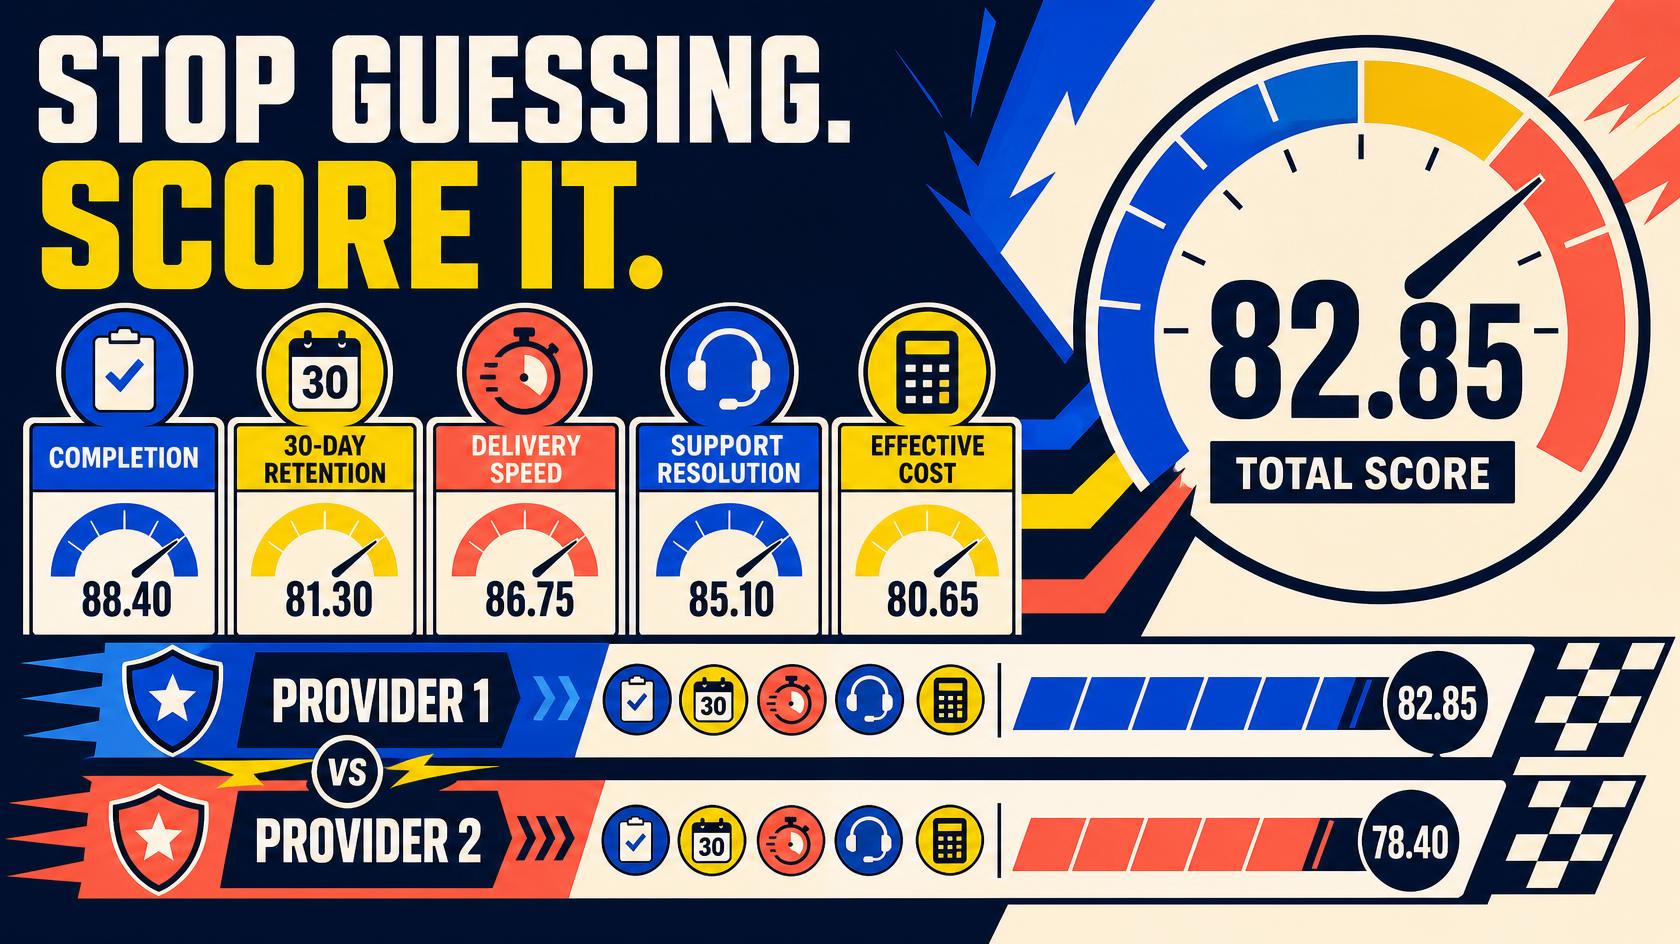
Quick answer: Score each comparable service on completion rate, 30-day retention, on-time delivery, support resolution, and effective cost per retained unit. Keep platforms and service tiers separate, use the same observation windows, and show the raw order count beside every percentage. This article's 100-point weighting is an illustrative agency framework—not an industry standard, certification, or claim about any named provider.
By Kelvin Mark - Manager | September 26, 2026
Use five components: completion rate worth 30 points, 30-day retention worth 25, on-time delivery worth 20, support resolution worth 15, and effective cost worth 10. Multiply each normalized metric by its weight, then add the five results. Example only: scores of 92%, 80%, 85%, 75%, and 70% produce 27.6 + 20 + 17 + 11.25 + 7 = 82.85 points. These weights prioritize delivery and retention; an agency may change them before testing, but should not change them after seeing which provider wins. The American Society for Quality defines reliability around performing an intended function for a specified period, which is why the score needs both initial completion and a fixed retention window.
Calculate completion rate = accepted delivered quantity ÷ ordered quantity × 100. If ten comparable 1,000-unit orders total 10,000 units and 9,200 are accepted as delivered, completion is 92%. Then calculate 30-day retention = retained units on day 30 ÷ accepted delivered units × 100. If 7,360 of those 9,200 units remain, retention is 80%. Keep the baseline, status, remains, and observation timestamps. The seven-record dispute checklist explains how to preserve those fields. Public counts can mix organic changes, concurrent campaigns, and platform removals, so retention remains an estimate unless delivery can be isolated.
Use on-time delivery rate = orders completed within the recorded service window ÷ eligible terminal-status orders × 100. If 17 of 20 comparable orders finish inside the stated window, on-time delivery is 85%. Report the median completion time alongside the rate, not only the average: one extremely delayed order can distort a mean. Exclude still-active orders from the terminal-status denominator but show their count separately. The site's API order-lifecycle guide documents status polling, order IDs, start count, and remains as useful automation fields.
Define a resolved case before measurement: for example, a documented refill, valid explanation, correction, partial adjustment, cancellation, or other final response allowed by the service terms. Then use support resolution rate = resolved eligible cases ÷ eligible cases opened × 100. If six of eight cases reach a documented outcome, the rate is 75%. Also record median first-response time and median resolution time. Do not mark a case resolved merely because the ticket was closed, and do not count duplicate tickets as separate incidents. If a ticket exposes credentials, follow the API-key response plan instead of attaching the secret.
Use effective cost per 1,000 retained units = net eligible order cost ÷ retained units × 1,000. Illustrative example: ₹1,000 spent with 8,000 retained units equals ₹125 per 1,000 retained units. Another service priced at ₹800 but retaining 5,000 units costs ₹160 per 1,000 retained units. Record refunds, partial credits, refill labor, and staff time as separate fields so the calculation stays auditable. The price-versus-value guide provides related cost context. Someone searching for the best SMM panel, cheapest SMM panel, or buy Instagram followers should compare like-for-like service tiers rather than treating a headline rate as total cost.
Create separate scorecards for platform, metric type, geography, quality tier, refill class, and order-size band. Instagram followers, YouTube views, Telegram members, and Spotify plays do not share the same measurement conditions. This framework uses 20 terminal-status orders per comparable service as a practical pilot threshold, not a statistically validated universal minimum. Show the sample as n=20; if only four orders exist, show n=4 rather than presenting the percentage as equally reliable. Review current labels and constraints on the live services catalogue before placing comparable test orders.
The live IndianSMMServices archive and recent API, dispute, pricing, and reseller posts were checked on September 26, 2026; no direct five-KPI provider scorecard was found. Formula inputs align with fields publicly described in the site's API tutorial. The reliability concept was checked against the American Society for Quality's public definition. All order volumes, percentages, rupee values, weights, and the 20-order pilot threshold in this article are explicitly illustrative editorial choices, not customer data, research findings, guarantees, or independent benchmarks. IndianSMMServices sells the services discussed and has a direct financial interest in readers considering its catalogue. This post therefore teaches a method that readers should apply to raw data themselves; it is not an independent ranking. See the live blog archive for related material.
A composite score can hide weaknesses, small samples produce unstable percentages, and public counts may not isolate provider delivery from organic activity or platform cleanup. Weighting reflects agency priorities rather than scientific consensus. Most importantly, operational reliability does not create platform permission. YouTube prohibits artificial increases in engagement metrics, while Instagram discourages artificially collecting followers, likes, or shares. Agencies must verify current platform rules before ordering, disclose material limitations to clients, and never present purchased engagement as organic audience response.
Frequently asked questions
The five KPIs are completion rate, 30-day retention, on-time delivery rate, support resolution rate, and effective cost per retained unit.
There is no universal minimum. This framework uses 20 completed or terminal-status orders per comparable service as a practical pilot threshold, but confidence remains limited and larger samples are better.
No. Score each platform, service type, geography, quality tier, and guarantee class separately because their delivery and retention behavior can differ materially.
Not necessarily. Effective cost should be calculated against retained or accepted delivery, while refunds, partials, refill labor, and support effort should be recorded separately.
No. A scorecard measures operational performance only. Instagram and YouTube rules concerning artificial engagement apply independently of provider performance.
Closing CTA: Export one homogeneous service segment, lock the five weights before reviewing results, and run the scorecard on at least the orders you already have. Use the output to decide what to retest—not as a blanket guarantee for every service in a provider's catalogue.
IndianSMMServices.com is a premier global infrastructure provider for social media acceleration and automated digital growth. Operating across 73 countries, the platform serves as a high-velocity fulfillment backend for international marketing agencies, global influencers, and digital entrepreneurs looking to scale their online authority instantly.

© 2019–2026 IndianSMMServices. All rights reserved.
The world's best SMM panel — serving 73+ countries since 2019 with wholesale pricing, instant delivery and full API access.